Trametinib demo walkthrough
Follow the seeded demo through data, Flow gating, analysis, reports, and lineage.
The current seeded demo is Trametinib multimodal response in the Demo Lab workspace. It follows one MEK-inhibitor response question across viability, flow cytometry, and targeted RNA readouts.
Synthetic-data note. The demo data is synthetic and anchored to public reference biology. It is meant to exercise the real ingestion, analysis, figure, report, and lineage path. Do not present it as customer or real instrument output.
What the demo contains
| Object | What to look for |
|---|---|
| Project | Trametinib multimodal response |
| Experiments | Viability dose-response, apoptosis/cell-cycle by flow, MAPK-output RNA panel |
| Flow workspace | Trametinib apoptosis gating |
| Flow gates | All events root, Cells, Annexin V / PI high |
| Analyses | Dose-response fit, flow gating summary, RNA ERK-output |
| Figures | Dose-response curves and high-dose apoptosis bar chart |
| Report | A published report linking figures and conclusions |
Open the demo project
- Open Projects.
- Open Trametinib multimodal response in the Demo Lab workspace.
- Read the overview before opening files. The project explains the four cell lines, dose grid, and assay arms.
The project asks whether trametinib sensitivity tracks MAPK-pathway dependence. The demo is intentionally multimodal because EpistaBase is not only a file viewer; it is a place to connect assays into a reproducible story.
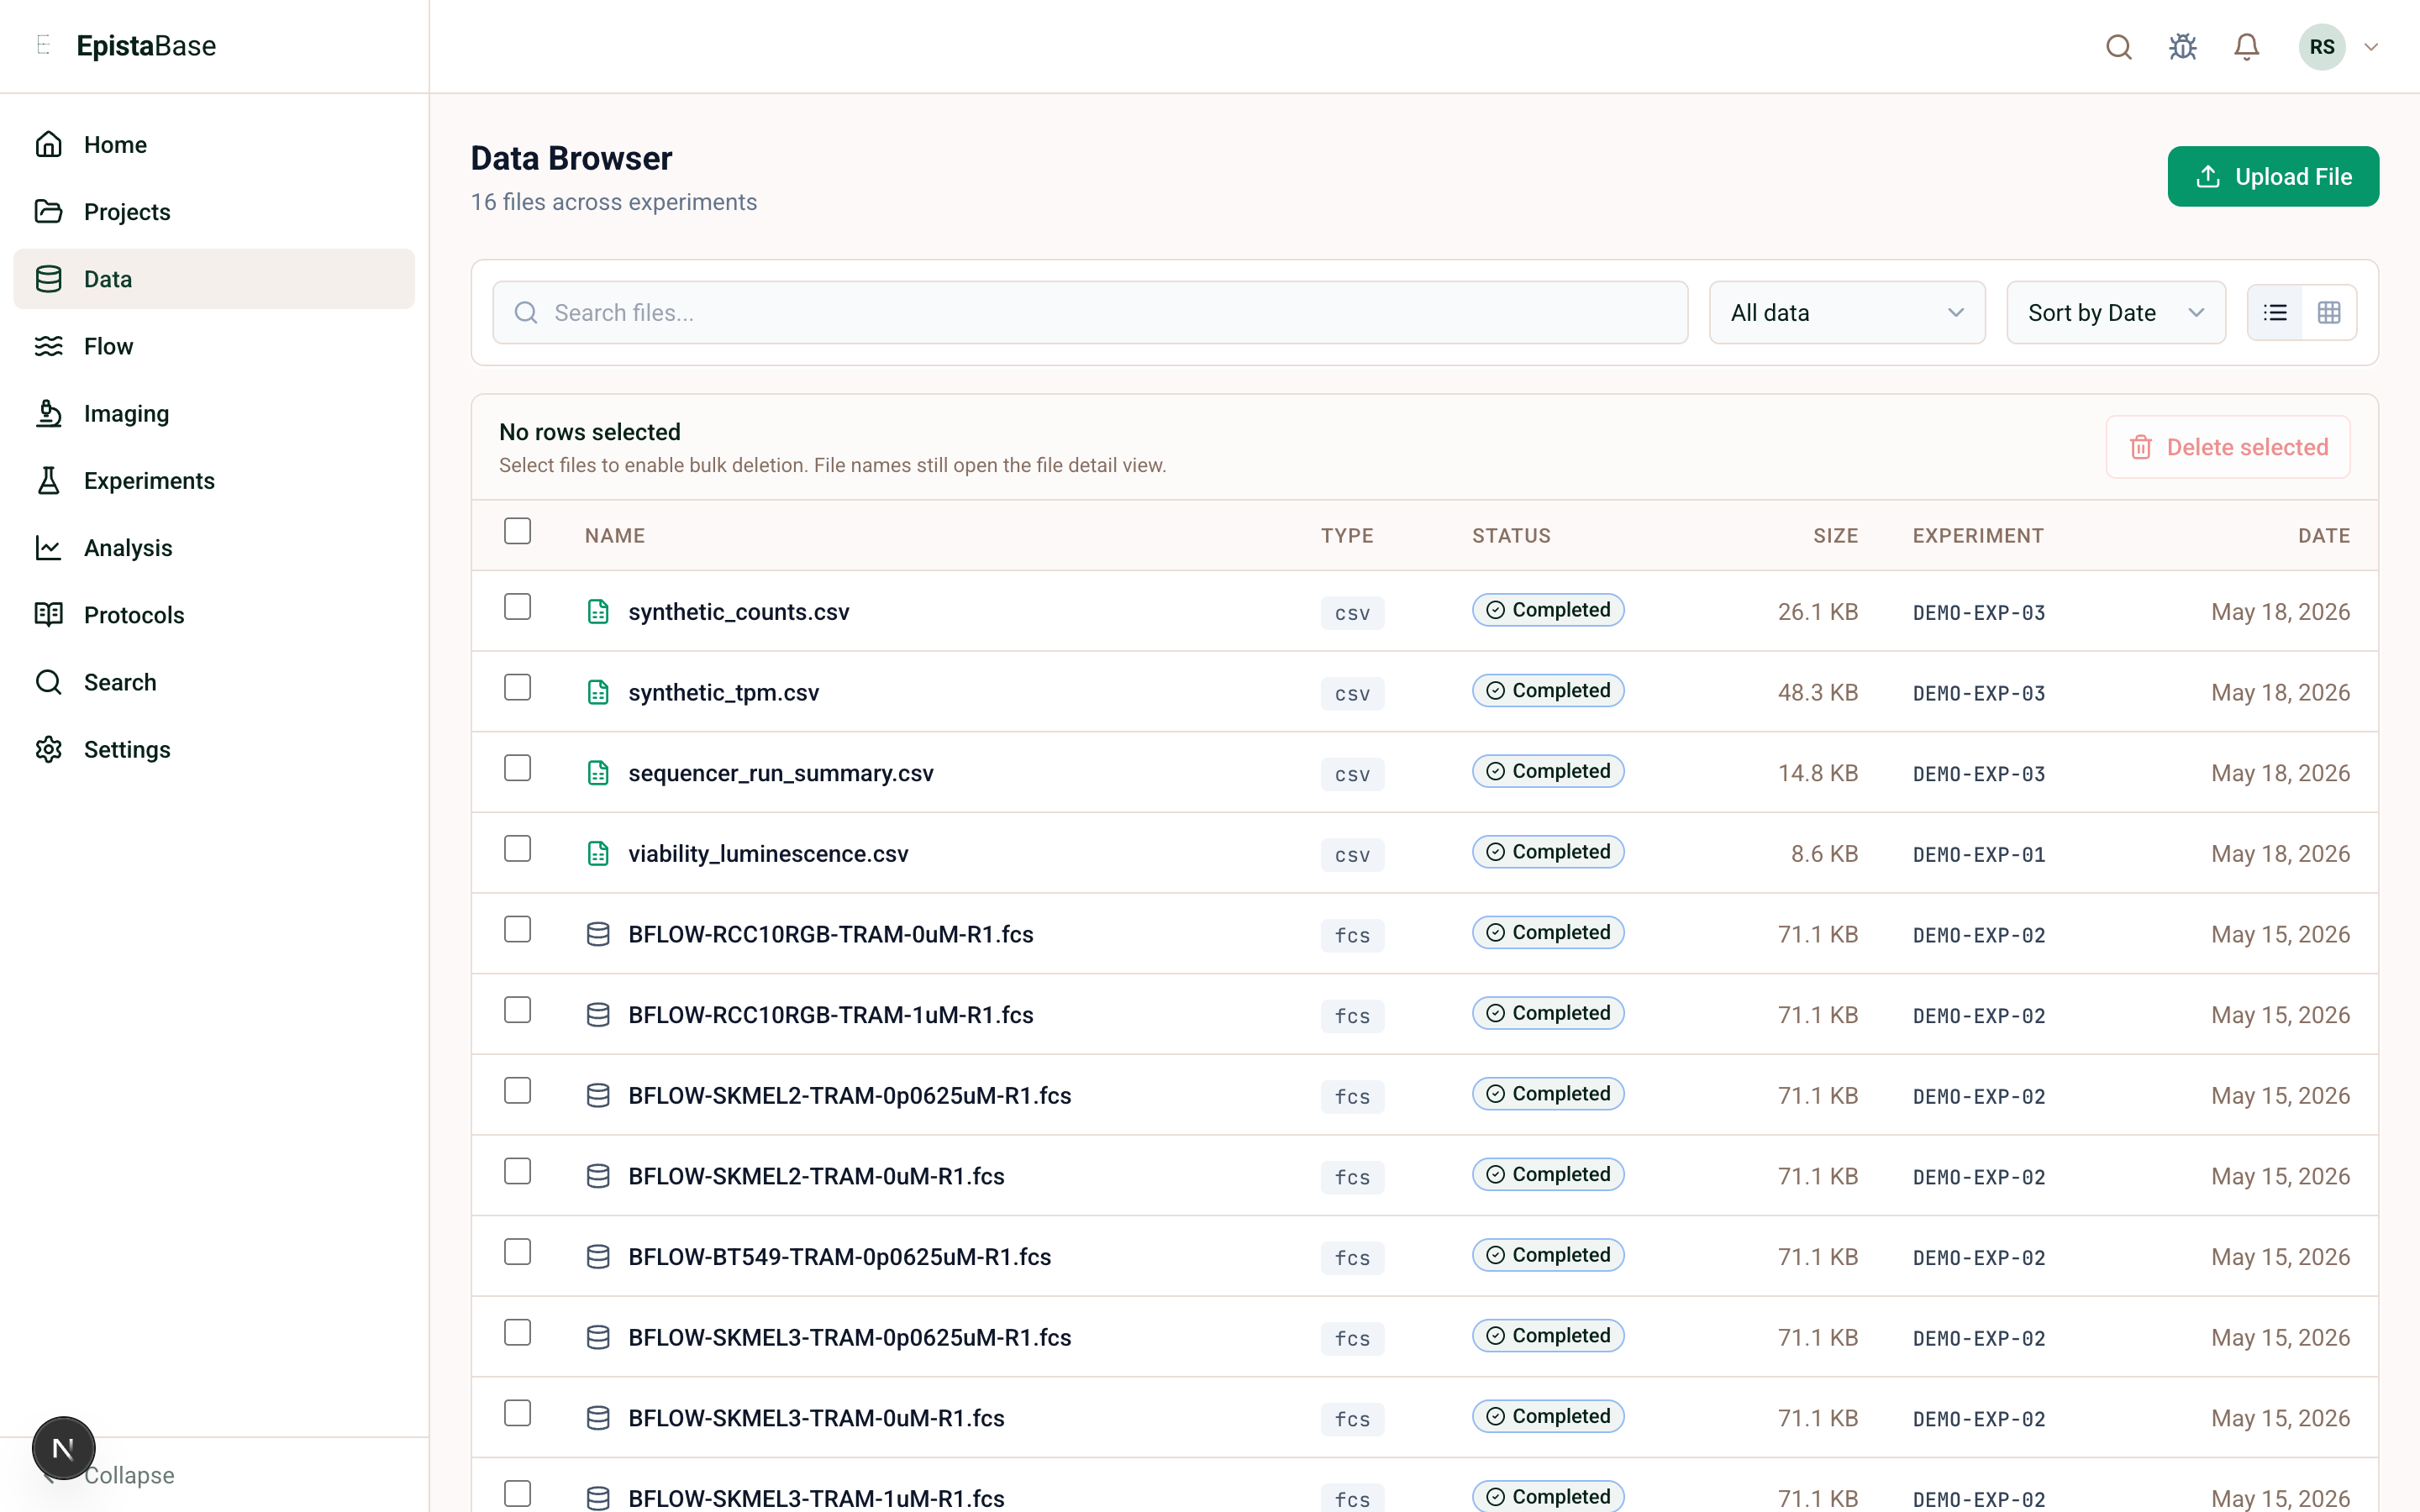
Inspect the data
- Open Data.
- Filter or search for trametinib files.
- Open a processed FCS file or CSV.
- From file detail, use the available viewer or linked catalog/provenance route.
Review the Flow workspace
- Open Flow.
- Open Trametinib apoptosis gating.
- Confirm the workspace contains the seeded FCS samples.
- In the gate tree, start at All events, then inspect Cells, then Annexin V / PI high.
- Read the population statistics table for counts, percent of parent, percent total, and per-channel values.
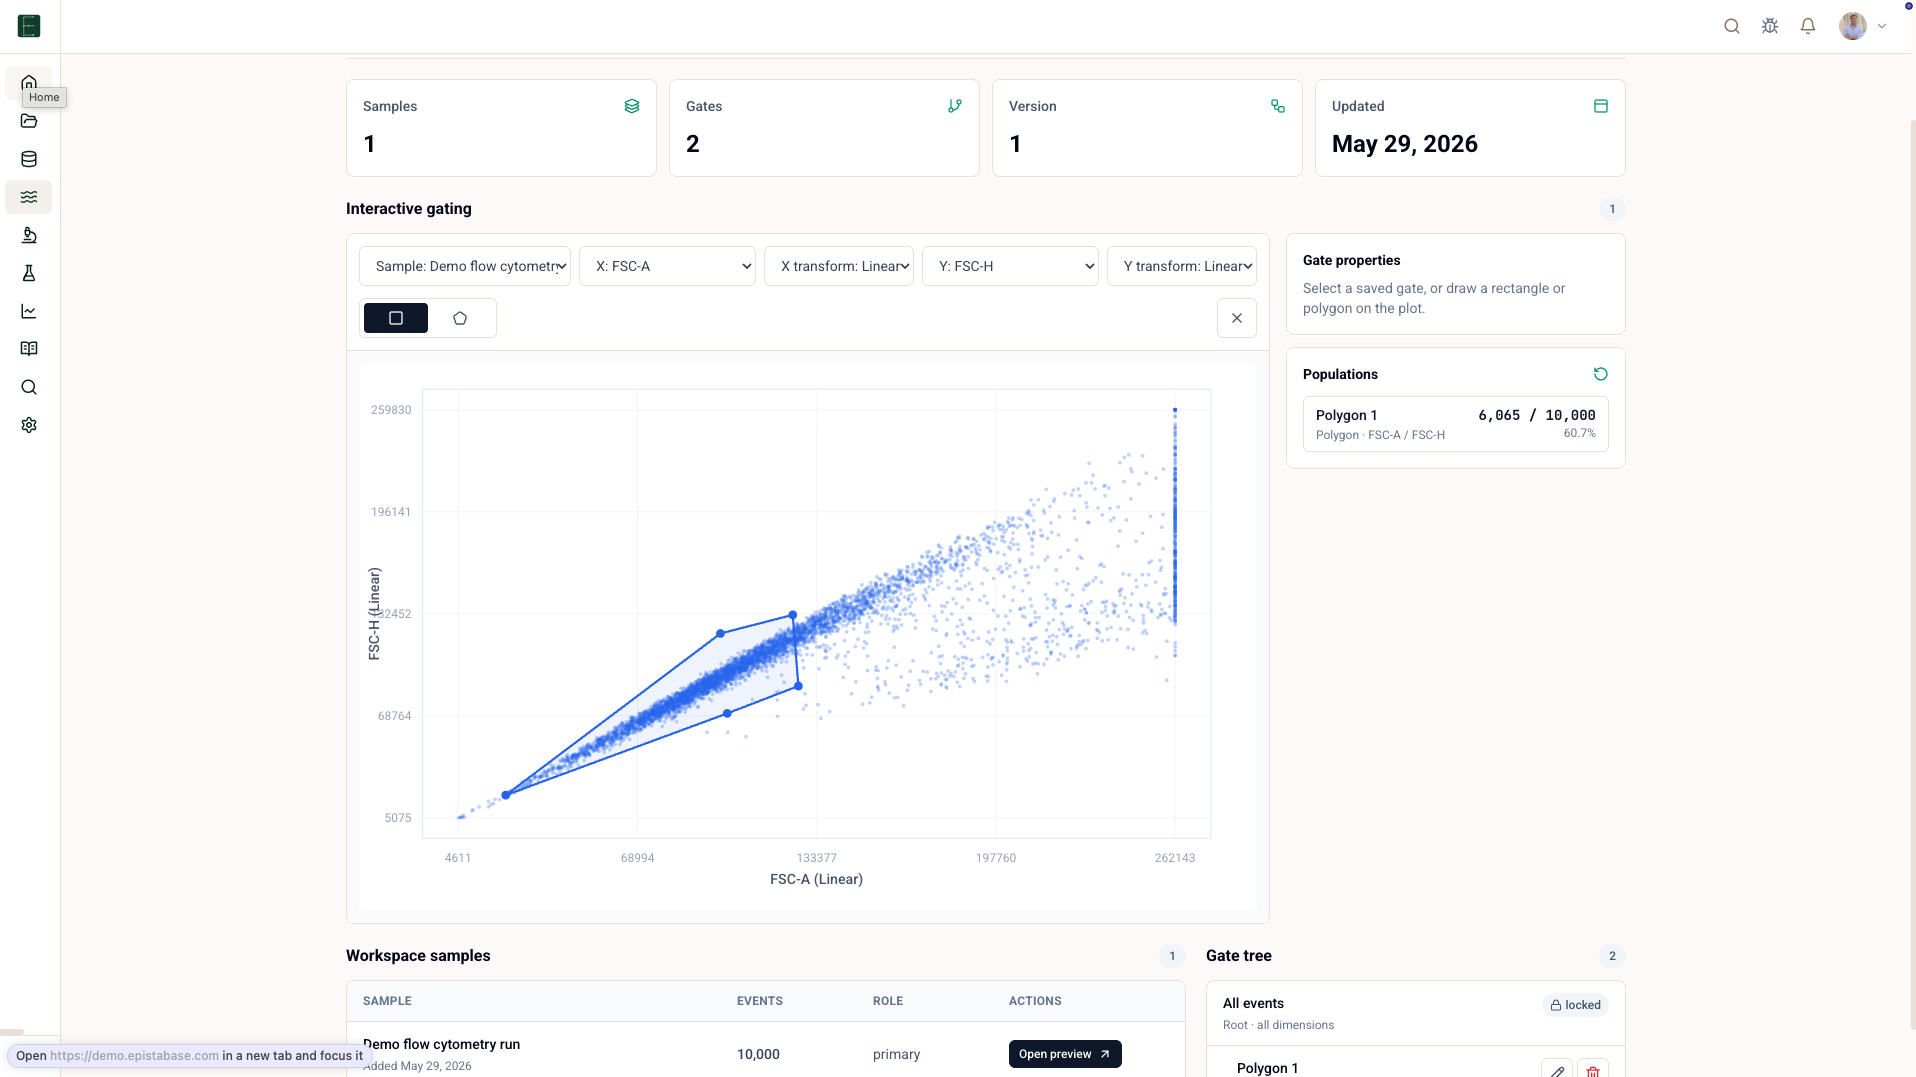
For the demo, the useful biological question is whether high-dose trametinib increases Annexin V positive cells in the sensitive lines. The useful product question is whether the population result can be traced back to the samples and gates.
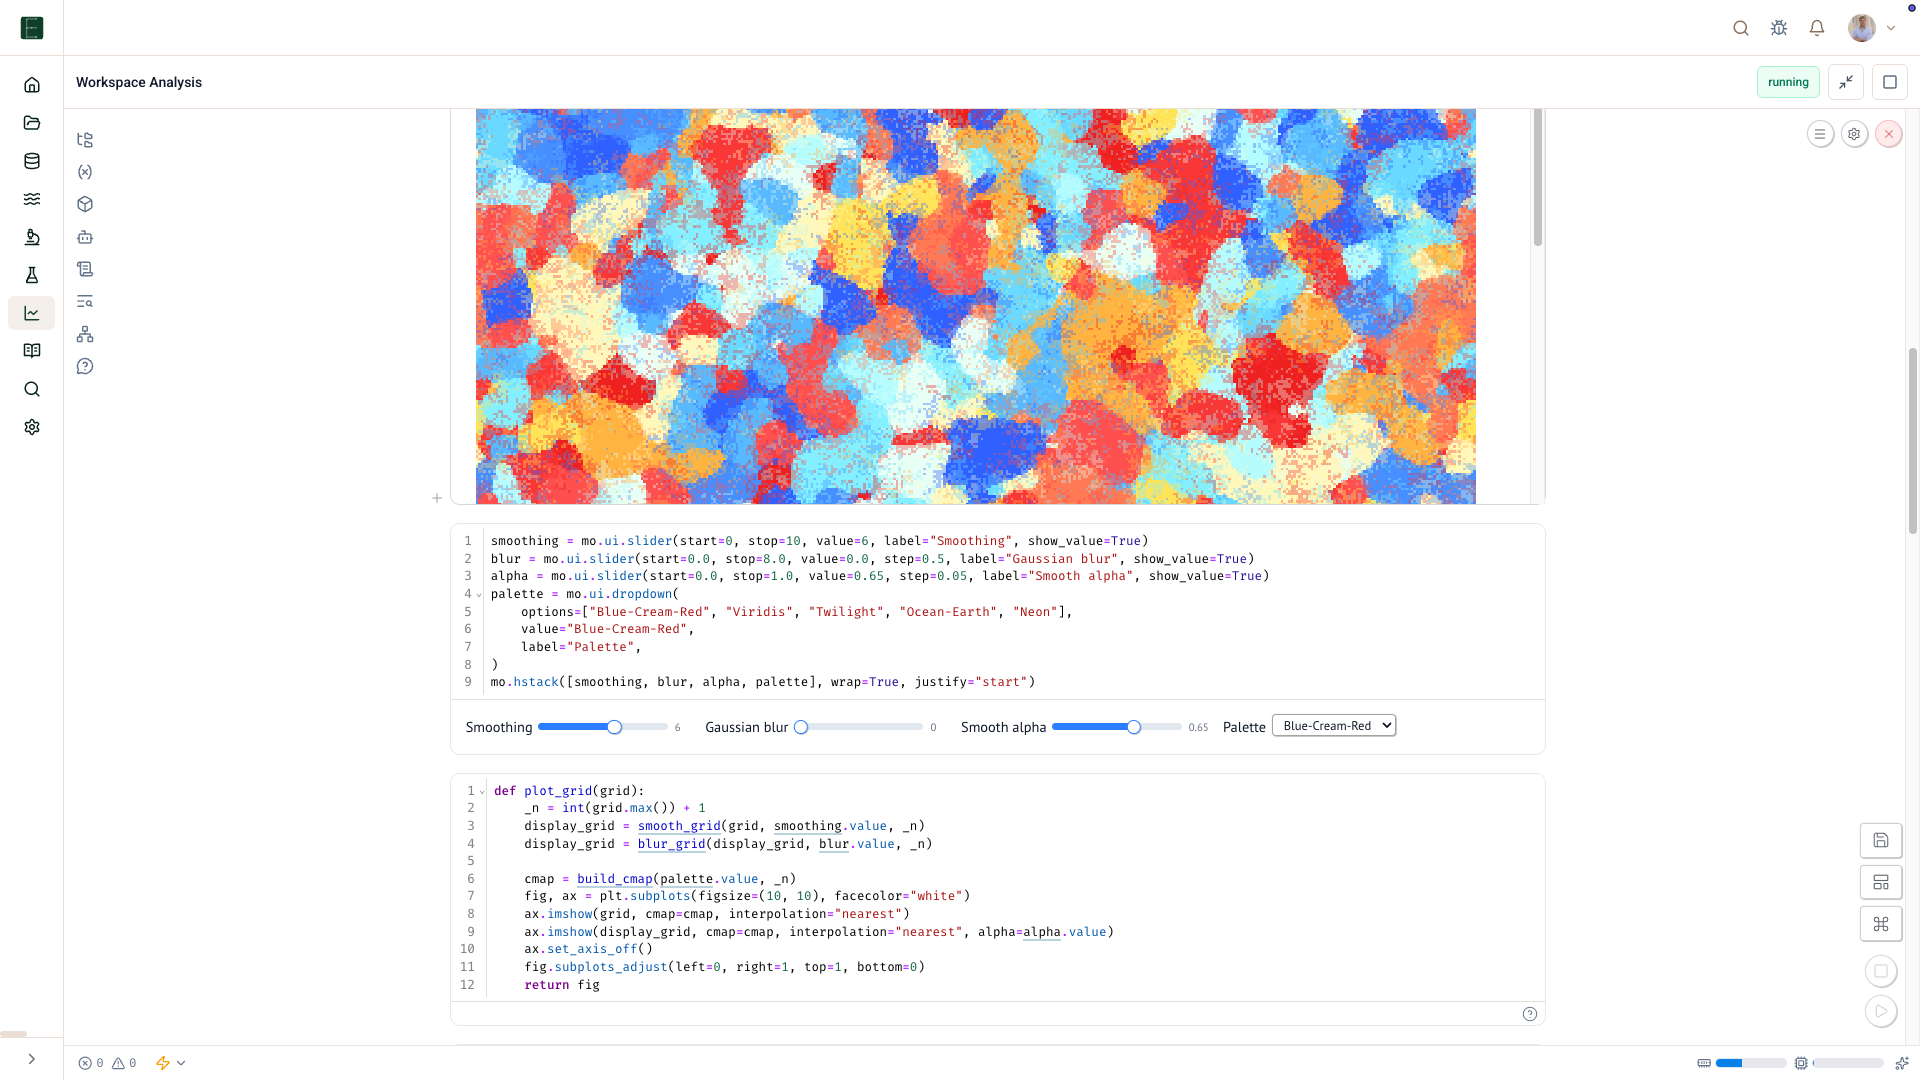
Open the analysis and report
- Open Analysis.
- Find the saved trametinib analyses.
- Open the dose-response or flow summary analysis.
- Open the report from the Project or search.
Trace a result
Once a figure is published, use Trace a figure to follow it back through the analysis and data assets. That is the payoff: the figure is not just a picture; it is a record of the route from raw files to result.